Wednesday, 13 February 2013

CTG from 31-Jan to 13-Feb 2013

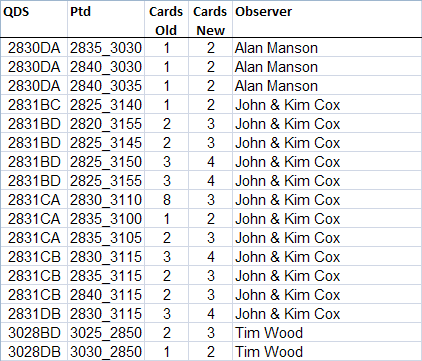
During the last fortnight we had 15 cards submitted that contributed to the "Cards-to-Green" project in KZN.
This equates to an average of 1.1/day, which is slightly below our overall average of 1.4/day.

The bulk of the cards were submitted by Tim Wood, during an effort to add depth to the area east of Paulpietersburg, with 2730 getting 6 cards and 2731 two cards.
John and Kim Cox continued their systematic coverage of their area with 2830 getting 5 cards and 2831 a single one.
Malcolm Robinson contributed a single card in 2930 which picked off the single island west of PMB, which was standing out like a sore thumb.
2830 remains our degree grid cell with the poorest coverage, with 326 cards needed. A card for virtually any pentad in 2830 will contribute to CTG.
The next poorest cover is in 2731 and 2732, both needing 187 card s each.

Looking at our table of contributors, Tim Wood topped the submission this fortnight with 8, while John and Kim Cox submitted 6 and Malcolm Robinson 1.


For our overall KZN figures over the last fortnight we had 73 cards submitted at a rate of 5.2 cards/day, below our overall average of 7.6/day. The records/card remained high with 59.8 against our average of 55.3.
Thanks to all who are contributing to SABAP2 in KZN.

Wednesday, 30 January 2013

KZN CTG from 3-Jan to 30-Jan

The last 4 weeks saw 45 cards submitted that contributed to the Cards-to-Green effort in KZN.
The bulk of these were in the Vryheid and Amatikulu areas, but there has also been a steady chipping away throughout the rest of the province.
This represents an average of 1.6 cards/day, this is still 0.2 above our overall average.

The biggest movers on this table were 2730 and 2831 each with 9 cards, and 2731 with 6.
3030 got a surprising 5 cards thanks to Tim Wood's efforts on the South Coast. This area has been a concern since Barry Porter's passing away, as he used to cover this area quite well.
As stated above, there was also a steady chipping away thoughout the province.
I must point out that although this table reflects 44 cards, but there were actually 45 submitted. There was an old card incorrectly allocated to 2929DC, for pentad 2955_2930. This pentad has been reduced to a single card now.
We have a change in the leaderboard for this period, with Duncan McKenzie managing 3 more than John and Kim Cox's 12, for this period.
The full list per observers as follows:
15  Duncan McKenzie [mostly Vryheid area]
12  John and Kim Cox [just inland along the coastal plain from Mandini to Imfolozi GR]
 7  Tim Wood [S Coast inland]
 4  Alan Manson [Tugela Valley and Donnybrook]
 2  Lawrie Chivers [Dundee area]
 1  Felicity Ellmore [Weenen area]
 1  Jason Boyce [Mkuzi area]
 1  Malcolm Robinson [the troublesome pentad at Henley Dam outside PMB]
 1  Shaun Chamberlain [Newcastle area]
 1  Mr M Taioe [Matatiele area]

Generally for SABAP2 in KZN over the last 4 weeks we managed 7.32 cards per day at an average of 58.4 records per cards. Both of these numbers are still well above our provincial average, but with a distinct tail-off in records per card, from 70.5 in the last period.
With our visitors having left us, we have also dropped to our usual third place in the daily cards submitted table, with Gauteng edging back above us to 7.54 cards/day in second, and the Western Cape back to first on 9.96 cards/day.
Thanks to all contributors to SABAP2, especially in KZN.

Wednesday, 2 January 2013

CTG for 6-Dec-12 to 2-Jan-13

The  KZN CTG map has seen some movement since the last map was published on 5-Dec, mostly with the colour change of the 5 red pentads in the Magudu area and the two red pentads in the Utrecht area. This was the result of the Atlas Bash from 6-9 Dec, based in this area courtesy of Malcolm Robinson. Tim Wood and Bob McCosh did the two Utrecht pentads on the way home.
There was also some steady chipping through most of the rest of KZN, particularly in the Melmoth-Ulundi area, but also with some contributions throughout KZN.
56 cards were submitted in the period that contributed to the KZN CTG mini-project, i.e. 2 CTG cards / day in the last two fortnights.
The biggest gain was in the 2731 degree square, with 23 cards courtesy of the Magudu Atlas Bash.
Next was 2831 with 12;
2730 had 7 cards;
while 2732, 2830 and 2930 had 3 each;
the rest were 1's and 2's in various degree squares.
2830 remains the neediest degree square with 335 cards needed to turn green;
followed by 2731 with 195 cards.

Attributing CTG cards to observers, once again we have John and Kim Cox at the top of the table, but at least we have a number of other observers in hot pursuit:
15  John and Kim Cox -mostly around Melmoth-Ulundi
12  Malcolm Robinson -Magudu but also some around Umvoti
11  Tim Wood -Magudu but also the 2 blanks near Utrecht
 8  Colin Summersgill -Magudu, Middlerest and Underberg
 5  Duncan McKenzie -Vryheid area
 1  Alan Manson -Kranskop
 1  Dave Everard -Van Reenen
 1  Drummond Densham -Nsikeni
 1  Lawrie Chivers -Dundee
 1  Mr M Saunders -Harding

On the general submissions front we have been enjoying a bit of a purple patch with 8.5 cards submitted per day over the last 28 days. The previous highest for this stat was for the fortnight ending 4 Jan 2012, where we averaged 9.4 cards / day.
This high rate of submissions has not been at the cost of any quality, these cards have averaged 70.5 records per card. This is the highest records / card that I have recorded, since I have been keeping these stats on a fortnightly basis in Oct 2008. The closest that we have come to this was in Nov 2010 with an average of 70.1.
From a project perspective we are also doing well, this 8.54 cards/day is the highest for any region over this period. Next closest was Gauteng with 6.79 followed by the Western Cape with 6.54.
On a rolling average basis, the W Cape is doing the best with 9.11 cards/day; followed by Gauteng with 6.27; while KZN is averaging 5.99.

Thanks to all who are contributing to SABAP2.

Wednesday, 5 December 2012

CTG for 22-Nov to 5-Dec 2012

Herewith this fortnight's Cards to Green map.
As per last fortnight we have a slight correction, John Cox pointed out that I had missed one of the sliver pentads along the iSimangaliso coast. This pentad only has two cards, so I have added another 2 to the number of cards needed for degree square 2832 - which now needs 8 cards and not the 6 as published last fortnight.
We look forward to the next report, where the five RED pentads centred around Magudu should be yellow, and hopefully some yellows turned green, after this weekend's Atlas Bash to clear these empties.
 The biggest movement was in 2831, which saw 12 cards submitted which contibute to the CTG mini-project, thanks to John and Kim Cox for their diligent and well targeted coverage of the area surrounding Richard's Bay.
Our worst off degree square, 2830, got 3 cards thanks to Alan Manson's efforts on BBD.
Tim Wood effort's around BBD saw him active in the Matatiele area, where 3028 got two cards.
As mentioned above, John and Kim again led the charge with 12 cards, Alan with 3 and Tim with 2.
It is interesting to note that some of the QDGC that received relatively poorer coverage in SABAP1 are doing better this time around, some examples:

2730CC OSIZWENI had 7 cards and 173 spp in SABAP1 against the SABAP2 75 and 227;
2730DD VRYHEID with 20/169 against 109/323 - actually just about all of the QDGC's around Vryheid are like this, but Vryheid's stats are really good;
2830BA NQUTU 9/112 and 14/148;
2830DA COLLESSIE with 4/103 and 12/169;
2930BD NOODSBERG with 11/128 and 22/185.

Looking at KZN's entire submissions, we have dipped a little this fortnight falling from a high of 7.4 cards/day last period to 5.3 this fortnight. Our cards have however had an increase in records/card, now up to 64.1/card from 60.0.

To put the daily card submission rate in perspective against the other 11 regions, the W Cape leads with 7.4 cards/days, followed by Gauteng with 6.4, then the E Cape on 6.0.
Looking at a twelve week average, the cards/day for the regions are as follows:
1.  W Cape 9.5
2.  Gauteng 6.2
3.  KZN 5.6
4.  Mpumalanga 5.2
5.  E Cape 5.1
6.  N Cape 3.8
7.  Limpopo 3.7
8.  North West 3.6
9.  Free State 3.1
10. Namibia 1.6
11. Swaziland 0.2
12. Lesotho 0.1

Wednesday, 21 November 2012

CTG for 8-21 Nov 2012

This fortnight saw some good movement with 16 cards submitted that contributed to the "Cards-to-Green" mini-project. There was also an adjustment to a card in Degree Square 2732, where a pentad code was corrected, i.e. data for a pentad was moved from a "CTG-deficient" pentad to a "CTG-excess" one.
This adjustment shows the total cards on this table to have moved by only 15, rather than the sixteen.
Most submissions were in southern KZN, where John and Kim Cox were busy over the last fortnight, while the Midlands and Coast gained three and Northern KZN one.
2830 remains our most poorly covered degree square with 341 cards needed.
2832 only needs 6 cards to be completely 'green', while 2930 now needs 53.
The credit for the most contributions to the CTG project again goes to John and Kim, with 12 cards. Tim Wood submitted 2 cards, while Johan and Estelle van Rooyen, and yours truly submitted a single card.
John reported that they atlased over 40 pentads in southern KZN and the Eastern Cape, 17 of which were new pentads.
Due to the way in which the pentads are allocated to each province, six of these 17 new pentads were allocated to KZN on the SABAP2 web table, so KZN has moved up from 1265 pentads to 1271pentads with coverage. Thanks John and Kim!
Unfortunately I have been using my GIS to calculate the CTG contributions, and by my calculations only one of these fell mostly in KZN, this is the one reflected on this table. As Tim Wood so rightly says, we should be looking at all pentads regardless of provincial allocation, especially this corner of the Eastern Cape. In any event the boundary has been moved anyway, there should be a whole lot more to EC anyway.
On the overall KZN front we had another good fortnight with 104 cards submitted, still with a high average of 60.0 records/card. This equates to 445.6 records/day, this is well above the KZN average of 424.8. The last time we achieved this was in January this year.
Well done KZN, and many thanks to all who contributed.

Friday, 9 November 2012

CTG fortnight ending 7-Nov-12

I have added in the Cards-to-Green map again.
A definite trend is emerging, with the areas around Richard's Bay, Durban and PMB forming core areas with an ever-expanding area radiating out from here. The CTG pentads are getting further and further away from these three centres.
13 cards were submitted in the last fortnight that contributed to the CTG effort.
The largest movement was in the 2931 degree with 5 cards.
2731 and 2732 were then tied on 3 cards each, with 2830 following with 2.
2830 remains our most poorly covered degree square with 342 cards needed. Second neediest is 2731 with 219 cards.
On the positive side 2828 only needs 4 cards to have complete four card coverage within KZN, while 2832 only needs 6 cards.
Credit for contributing CTG's goes once again to John and Kim Cox with 5 cards. At least this fortnight Malcolm Robinson provided some competition with 3 cards, Hanneline Smit and Alan Manson each contributed 2 cards and Lance Robinson one.
We have in the last 2 fortnights had 13 CTG's contributed. The previous two fortnight's had 10 CTG's.

For all cards submitted for KZN we had a good fortnight with 97 cards submitted with an average of 62.2 records/card.
This equated to a submission rate of 6.9 cards/day which is certainly at the upper end of the scale for KZN.
An interesting stat is that this works out at 431.1 records/day. The last fortnight that we achieved this was 28-Mar-2012.

Wednesday, 24 October 2012

Cards to Green during the fortnight ending 24-Oct-12


 We had 13 cards submitted during the last fortnight that contributed towards the "Cards-to-Green" mini-project in KZN.
A dozen of them were from the 2831 degree-square and the other was from 2832.
 All of these cards were contributed by John and Kim Cox, an excellent effort on their part. Good to see that there were two pentads with only a single card that now have their second card.
Come on the rest of KZN, let's have some contributions from the rest of you as well!
Regarding the usual stats for KZN we had a definite upsurge in submissions. This happily coincided, as one would expect in spring, with an attendant surge in species per card as well.
We had 74 cards submitted over the last two weeks with an average of 64.1 records per card, which equals 4 747 records submitted.
This was at a submission rate of 5.3 cards per day, up from 3.6 last fortnight, and the highest rate since 29-Aug-2012. The last time that we managed an average of 64.1 or higher records per card was 15-Feb-2012. Though to be fair we did manage 63.8 for the period ending 26-Sep-2012.