
As per last fortnight we have a slight correction, John Cox pointed out that I had missed one of the sliver pentads along the iSimangaliso coast. This pentad only has two cards, so I have added another 2 to the number of cards needed for degree square 2832 - which now needs 8 cards and not the 6 as published last fortnight.
We look forward to the next report, where the five RED pentads centred around Magudu should be yellow, and hopefully some yellows turned green, after this weekend's Atlas Bash to clear these empties.

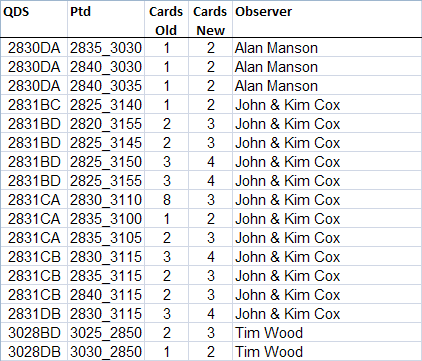
Our worst off degree square, 2830, got 3 cards thanks to Alan Manson's efforts on BBD.
Tim Wood effort's around BBD saw him active in the Matatiele area, where 3028 got two cards.
As mentioned above, John and Kim again led the charge with 12 cards, Alan with 3 and Tim with 2.
It is interesting to note that some of the QDGC that received relatively poorer coverage in SABAP1 are doing better this time around, some examples:
2730CC OSIZWENI had 7 cards and 173 spp in SABAP1 against the SABAP2 75 and 227;
2730DD VRYHEID with 20/169 against 109/323 - actually just about all of the QDGC's around Vryheid are like this, but Vryheid's stats are really good;
2830BA NQUTU 9/112 and 14/148;
2830DA COLLESSIE with 4/103 and 12/169;
2930BD NOODSBERG with 11/128 and 22/185.
Looking at KZN's entire submissions, we have dipped a little this fortnight falling from a high of 7.4 cards/day last period to 5.3 this fortnight. Our cards have however had an increase in records/card, now up to 64.1/card from 60.0.
To put the daily card submission rate in perspective against the other 11 regions, the W Cape leads with 7.4 cards/days, followed by Gauteng with 6.4, then the E Cape on 6.0.
Looking at a twelve week average, the cards/day for the regions are as follows:
1. W Cape 9.5
2. Gauteng 6.2
3. KZN 5.6
4. Mpumalanga 5.2
5. E Cape 5.1
6. N Cape 3.8
7. Limpopo 3.7
8. North West 3.6
9. Free State 3.1
10. Namibia 1.6
11. Swaziland 0.2
12. Lesotho 0.1